Record number of sustainable journeys in Barcelona in 2023
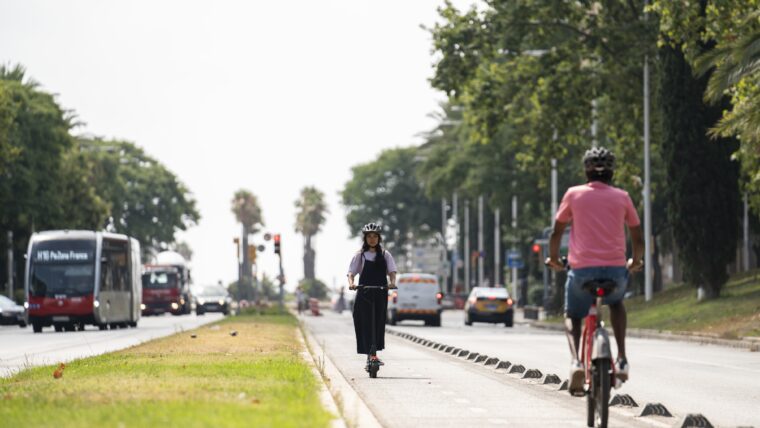
The first full Mobility Agreement meeting for this term of office included a presentation of the main indicators on journeys made in the city, with a notable record: 80.1% of urban journeys in 2023 were made on foot, by bike, on personal mobility vehicles or public transport, compared to 20% with private vehicles. Work to draft the new Urban Mobility Plan (PMU) 2025-2030 also got under way.
Created in 1998, the Mobility Agreement offers a space for participation and dialogue and is made up of associations, companies, public bodies and organisations, acting as a participatory forum for consensus on Barcelona’s mobility model and defining measures to improve mobility and road safety in the city.
Today’s session presented the latest balance of mobility indicators from the Urban Mobility Plan (PMU) 2024, a new open data website to ensure access to this information and the areas of work for drafting the next PMU.
Barcelona’s mobility figures as open data
Today’s full session also presented a new website with basic mobility data, including historical indicators and current information which will regularly be updated. The new tool contributes to transparency, with open data that enables members of the public to consult information and engage with it.
Notable figures from the indicators for 2023 include:
- Total number of journeys: 42.1 % on foot, 34.2% on public transport and 19.9% with private transport. The other 3.8% of journeys were made with personal mobility vehicles or bicycles.
- Public transport: journeys were up by 18% compared to 2022, reaching a total of 2,858,636.
- On foot: an estimated 3,512,790 journeys were made every day on foot in the city in 2023, representing an increase of 2% compared to the previous year.
- Bicycles and PMVs: these journeys were up by 7% compared to 2022, with a total of 318,609.
- Private motor vehicles: these dropped by 0.3% compared to the previous year and totalled 1,660,771 journeys.
- Share of public space devoted to mobility (new indicator): pedestrian space accounts for 50.5%; bicycle space 2.6%; public transport 3.8% (counting bus lanes and tram space); service lanes, reserved parking and loading/unloading zones, 8.8%, and the rest of the road surfaces, 34.3% in all, corresponds to general circulation.
- Urban goods distribution: the city has 11,198 loading and unloading spaces.
Process to draft the new PMU under way
The prior analysis for the new PMU highlights the main challenges to be tackled and sets out three strategic areas:
- Establish a mobility model with safe, efficient and sustainable surface space
- Achieve a public transport system that attracts more passengers than private vehicles
- Reduce dependency on cars and motorcycles and mitigate the negative aspects that come with them
The goal is a consensual proposal that will gain initial approval at the end of 2024.


More information
Related news
-

-
 27/01/2024 - 11:00 h Mobility and transport Aribau and Muntaner to get new service lanes to free up pavements
 -
 10/01/2024 - 12:52 h Mobility and transport Record number of public transport ticket validations in 2023 as figures top 643 million
 -
 04/01/2024 - 12:53 h Mobility and transport New traffic signs obliging riders to get off bikes and scooters installed at another 24 points in Ciutat Vella